Users spend an average of 40 minutes a day on YouTube, so it makes sense to monetize that attention with advertising. Unfortunately, YouTube ads have a lot of moving parts to them and it can be hard to know how you’re really doing unless you can accurately compare your results to others.
That’s where YouTube advertising benchmarks come in. Let’s take a closer look at each one, how they work, and what you can do if your own account doesn’t meet the standard.
YouTube Advertising Benchmarks
Cost per view (CPV)
With an average cost per view of $0.026 YouTube, the social media platform, remains one of the most cost-effective ways to advertise your brand. The cost per view is calculated by dividing the overall cost by the number of views — which sounds simple until you get into the nitty-gritty of what constitutes a “view.”
According to YouTube, a view is counted when someone either interacts with your ad or watches 30 seconds of it (or if it’s shorter than 30 seconds, the entire duration). If there’s no view, there’s no cost, so if they skip a few seconds in, you don’t pay for it.
But different types of ads are counted differently.
For TrueView instream video ads, a view is counted when:
- Someone watches a full ad that’s 11–30 seconds long
- Someone watches at least 30 seconds of an ad that’s more than 30 seconds long
- Someone interacts with the ad.
For TrueView video discovery ads, a view is counted when someone clicks the ad and the video starts to play.
If you’re paying less than the average rate, it can mean that your ads are performing well with their intended audience. If you’re paying more, it means that something’s off — maybe your creative isn’t quite resonating with your viewers or you need to refine your targeting a bit more (or both).
View rate
The average view rate of a YouTube in-stream ad is 31.9%. It’s calculated, much like cost per view, by dividing the total number of views by the total impressions.
This metric tells you how relevant an ad is. If you’re involved with paid advertising, you could think of it as a quality score. In short, your view rate is the number of views on your specific YouTube ad compared to how many times it’s shown.
Before you get your hopes up, there’s no such thing as a 100% view rate.
In order to determine how your ads perform compared to others, you’ll need to carefully scrutinize your ads and see where your view rate numbers fall below the average for your particular industry and audience.
Just like with CPV, there could be a disconnect between you and your audience or your creative just isn’t generating attention.
Watch time
Watch time is not the same as view rate, although they sound similar. As its name implies, this is the total time that people watched your ad, shown in seconds.
Watch time is an absolute metric, but it can help you evaluate how “sticky” your videos are. Are people watching the whole video? Are they exiting after a few seconds?
View duration
A well-performing video will hold viewers for about 70-80% of the video length. But don’t be surprised if you see a drop-off around the halfway point, or 50-60% of the video. That seems to be the drop-off point for viewers who are looking for specific information from your video.
That’s why it’s important to place your call to action or ad overlay in the first half of your video. You’ll get a clickthrough even if a viewer doesn’t watch the entire video. And though your watch time isn’t as high as the YouTube advertising benchmarks, your video will still be effective at converting.
Average watch time and cost per view
Along with your specific metrics on views, view rate, and watch time, you can track your average watch time and cost per view. These benchmarks are simply the averages for the data reported in the categories above.
What About Engagement Metrics?
Beyond these specific YouTube advertising metrics, there are other metrics you’ll want to be aware of that also paint a picture of how your videos are performing, namely your engagement metrics.
View rate is an example of an engagement metric, but there’s also:
- Number of clicks
- Click-through rate
- Engagements
- Engagement rate
The engagement rate doesn’t reflect the number of conversions, but rather is calculated by adding together the number of likes, dislikes, and comments within a certain time period and then dividing that number by the total number of subscribers.
To see where your own ad performance falls on the scale, check out the graphic below: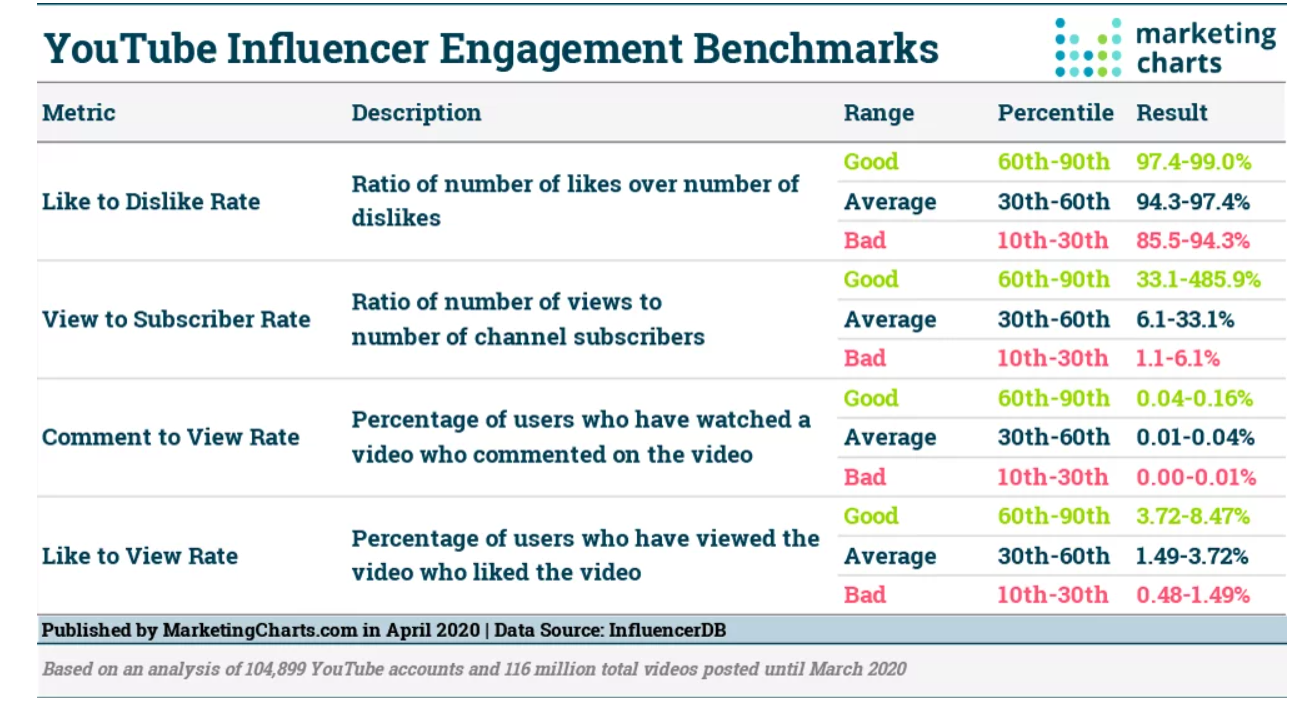
Other engagement metrics include:
Clickthrough rate (CTR)
The click-through rate, just like other rates in YouTube advertising benchmarks, is the number of clicks that your ad gets in comparison to the number of times it’s shown. If your CTR is rather low compared to other numbers, consider how the video ties in with your overall call-to-action and your landing page.
For instance, is there anything that happens after that click that could be causing friction for your users? Does the video flow well to the landing page, and do users who click there get acclimated quickly to your offer, or does it feel like the video and the page it directs to are two separate worlds?
Engagements
As noted above, engagements are not conversions, but rather the number of clicks on interactive elements in your video. These interactive elements can include teasers, icons or other clickable points that don’t specifically drive users off the video to a landing page or another website. Correspondingly, the engagement rate is the number of engagements on your ad compared to how many times it was shown.
Video viewership
This number will tell you how often a video plays to a certain length: 25%, 50%, 75% or 100%. Here again, if you have a call-to-action midway through your video, don’t be surprised if the viewership drops dramatically at that point.
User-based YouTube Advertising Benchmarks
Last but certainly not least, there are user-based YouTube advertising benchmarks. These include:
Unique users
This is simply the number of users that saw your ad within the specific timeframe that you want to measure.
Unique cookies
Cookies are bits of information that are specific to an individual’s browser on their computer or mobile device. Unique cookies reflect that number.
Unique viewers (cookies)
Finally, this metric will tell you the number of times that individual browsers viewed your video during the time frame you specify.
Which Metrics Matter Most?
It’s important to understand that every account on YouTube is unique. And despite the fact that there are many channels covering the same topic in the same way, none of them is a precise and accurate representation of the YouTube advertising benchmarks that one should have.
So for example, if you’ve created an ad in your industry that is designed to promote brand awareness, and a competitor has created an ad that’s a comparison between their product and yours, although you’re both in the same industry promoting to a similar audience, you’re going to have drastically different numbers that you’ll need to evaluate in order to determine how well your respective ads performed.
What’s more, different metrics matter at different points in the customer journey:
Top of Funnel – Views, view rate, unique users and engagements matter most at the top of the funnel. These are the users who have likely never heard of your brand, but you’ve piqued their curiosity.
Middle of Funnel – The consideration stage of the funnel is where watch time, average watch time, and unique viewers are the most important. Visitors are actively comparing and deciding among your solution versus others, and these metrics lend to how well your ads are doing to convince them that yours is their best choice.
Bottom of Funnel – This is where the rubber meets the road in terms of how well your video is actually working to convert. Here, the metrics that matter most are your clicks and your clickthrough rate
What to Remember About Metrics
It can be tempting to get carried away with metrics and seeing how you measure up to your competitors. And while it’s good to know the basics about YouTube advertising benchmarks, don’t turn it into an obsession.
At the end of the day, the only metrics that matter are those from your own account.
- How well are you doing creating ads that really speak to your target audience?
- Are those ads interesting enough to hold their attention for more than a few seconds?
- Are those ads leading to clicks and engagements?
- If not, all the benchmarks in the world won’t help you (other than to perhaps discourage you!)
There’s nothing wrong with taking a look at how well your ads are performing compared to others, but remember that no two ads are exactly alike, nor are they going to attract the exact same kind of customers.
Concentrate on looking at your specific metrics and asking yourself how you can improve them. If your competitors’ metrics are better, take a step back and think about why that may be happening. It’s likely more than “they have bigger pockets.”
While it’s true that they may have better name recognition and more to spend, every business had to start somewhere. Every business has to build their account subscriber by subscriber — just as you’re doing now.
By concentrating on your metrics and making your ads the best they can possibly be, you’ll be able to watch them grow and improve over time with the kind of knowledge that only comes from a pure dedication to giving your users the best experience possible.
0 comments